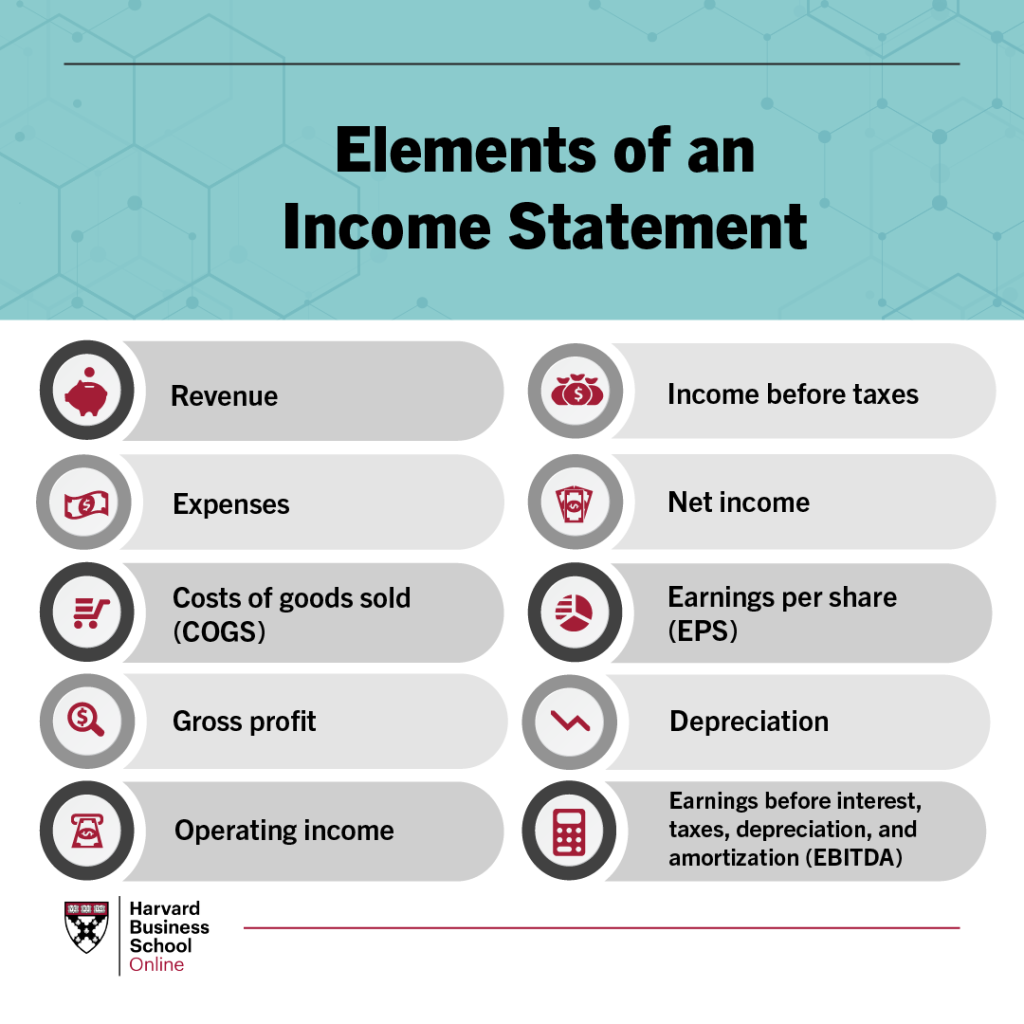
Introduction
Understanding how to evaluate an income statement is crucial for business owners, investors, and financial analysts.
This comprehensive guide will walk you through the process using a practical example and detailed analysis of each component.
Learn more about professional bookkeeping services in Dubai
Sample Income Statement: Tech Solutions LLC
(All figures in thousands AED)
TECH SOLUTIONS LLC
Income Statement
For Years Ending December 31, 2022 and 2023

                                    2023        2022        Change
Revenues                           1,000        800         +25%
Cost of Goods Sold                 (400)       (300)       +33%
Gross Profit                        600         500         +20%

Operating Expenses:
Salaries                           (200)       (150)       +33%
Selling and Marketing              (100)        (70)       +43%
General & Administrative            (50)        (45)       +11%
EBITDA                              250         235         +6%

Depreciation & Amortization         (30)        (25)       +20%
EBIT                                220         210         +5%

Interest Expense                    (20)        (15)       +33%
Profit Before Tax                   200         195         +3%

Tax Expense (15%)                   (30)        (29)       +3%
Net Profit                          170         166         +2%
Detailed Analysis
1. REVENUES
Key Findings:
- 25% year-over-year growth (800K to 1,000K AED)
- GAAP Compliance Check: Revenue recognition principles followed
- Steady growth trajectory indicating market expansion
Analysis Approach:
- Compare with industry growth rate (UAE tech sector average: 15%)
- Verify revenue recognition timing
- Check for any one-off items or seasonal impacts
Learn about financial variance analysis for small businesses
2. COST OF GOODS SOLD
Key Metrics:
2023 COGS Ratio: 40% (400/1,000)
2022 COGS Ratio: 37.5% (300/800)
Gross Margin 2023: 60%
Gross Margin 2022: 62.5%
Analysis:
- COGS growing faster than revenue (33% vs 25%)
- Slight decline in gross margin indicates potential pricing pressure
- Need to investigate cost control measures
3. SALARIES
Key Metrics:
2023 Salary to Revenue: 20%
2022 Salary to Revenue: 18.75%
Analysis:
- Salary expenses growing faster than revenue (33% vs 25%)
- Might indicate:
- Business expansion
- New hires
- Salary increments
- Potential inefficiency
4. SELLING AND MARKETING
Key Metrics:
2023 Marketing Ratio: 10%
2022 Marketing Ratio: 8.75%
Analysis:
- 43% increase in marketing spend
- Revenue growth of 25% suggests reasonable ROI
- Higher than industry average (typical 8-9%)
5. GENERAL & ADMINISTRATIVE
Key Metrics:
2023 G&A Ratio: 5%
2022 G&A Ratio: 5.6%
Analysis:
- Improved G&A efficiency
- Lower percentage of revenue despite business growth
- Good cost control in administrative areas
6. EBITDA
Key Metrics:
2023 EBITDA Margin: 25%
2022 EBITDA Margin: 29.4%
Analysis:
- Positive EBITDA growth but margin compression
- Compare with industry average (UAE tech sector: 22%)
- Operational efficiency needs attention
7. DEPRECIATION AND AMORTIZATION
Key Metrics:
2023 D&A to Revenue: 3%
2022 D&A to Revenue: 3.1%
Analysis:
- Consistent with business growth
- Check CAPEX relationship
- Review asset useful life assumptions
8. INTEREST
Key Metrics:
2023 Interest Coverage: 12.5x (250/20)
2022 Interest Coverage: 15.7x (235/15)
Analysis:
- Strong interest coverage ratio
- Slight decline needs monitoring
- Compare with industry benchmark (10x typical minimum)
9. PROFIT BEFORE TAXATION
Key Metrics:
2023 PBT Margin: 20%
2022 PBT Margin: 24.4%
Analysis:
- Margin compression evident
- Operating leverage impact visible
- Need cost optimization strategy
10. TAX
Key Metrics:
Effective Tax Rate 2023: 15%
Effective Tax Rate 2022: 14.9%
Analysis:
- Consistent effective tax rate
- No unusual variations
- Check for available tax incentives
11. NET PROFIT
Key Metrics:
2023 Net Profit Margin: 17%
2022 Net Profit Margin: 20.75%
Analysis:
- Margin compression through the P&L
- Still above industry average (15%)
- Need margin improvement strategy
Ratio Analysis Framework
1. Understanding Ratios
- Define the purpose of each ratio
- Establish calculation methodology
- Set benchmarks and targets
2. Result Interpretation
- Compare with historical trends
- Analyze deviations
- Identify patterns
3. Comparative Analysis
- Industry benchmarking
- Peer comparison
- Market position evaluation
4. Action Planning
- Identify improvement areas
- Set specific targets
- Develop implementation strategies
Recommended Actions for Tech Solutions LLC
- Cost Management:
- Review supplier contracts
- Optimize resource allocation
- Implement cost control measures
- Revenue Enhancement:
- Analyze pricing strategy
- Explore new market opportunities
- Strengthen customer relationships
- Operational Efficiency:
- Review staffing models
- Optimize marketing spend
- Improve administrative processes
Explore online bookkeeping services to streamline your finances
Conclusion
Effective income statement evaluation requires:
- Systematic analysis of all components
- Understanding of industry context
- Regular monitoring and comparison
- Action-oriented approach
Remember that numbers tell a story – your job is to understand that story and use it to make informed business decisions.
Additional Resources


